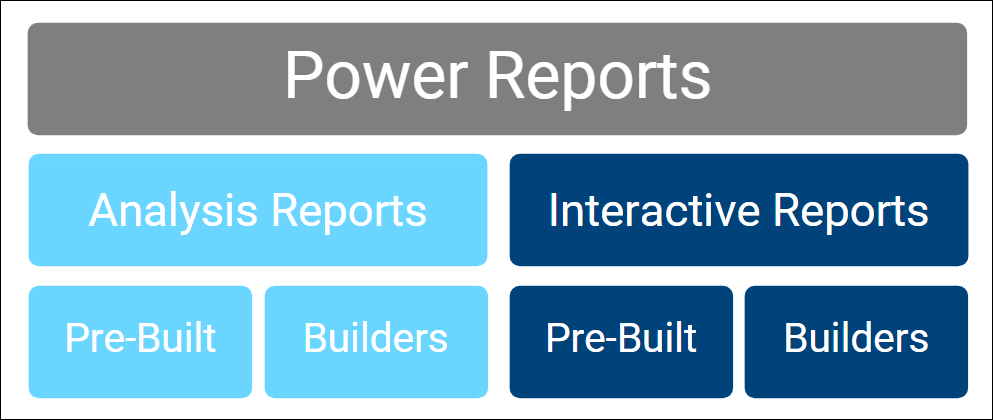
There are two types of Power Reports: Analysis reports and Interactive reports. There are two formats for Analysis and Interactive reports: Pre-Built reports and Builders. Let’s explore these different report types and formats.
Reporting Types: Analysis vs. Interactive
There are two types of Power Reports: Analysis reports and Interactive reports. Let’s learn about the differences between these two report types and when you would use each one.
Analysis Reports
These reports are good for:
- Viewing amounts, counts, and percentages
- Visualizing data as charts and graphs
These reports are structured by rows, columns, and measures. There are also totals and subtotals.
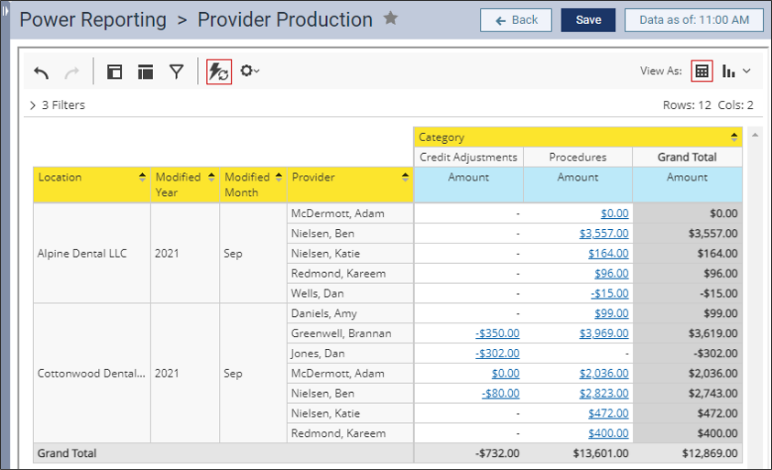
Examples of Analysis Reports: Provider Production, Applied Collection, Insurance Utilization, Production Summary
Interactive Reports
These reports are good for:
- Lists
- Large data sets without calculations
These reports are structured by groups and columns. They can also have built-in prompts which filter the report.
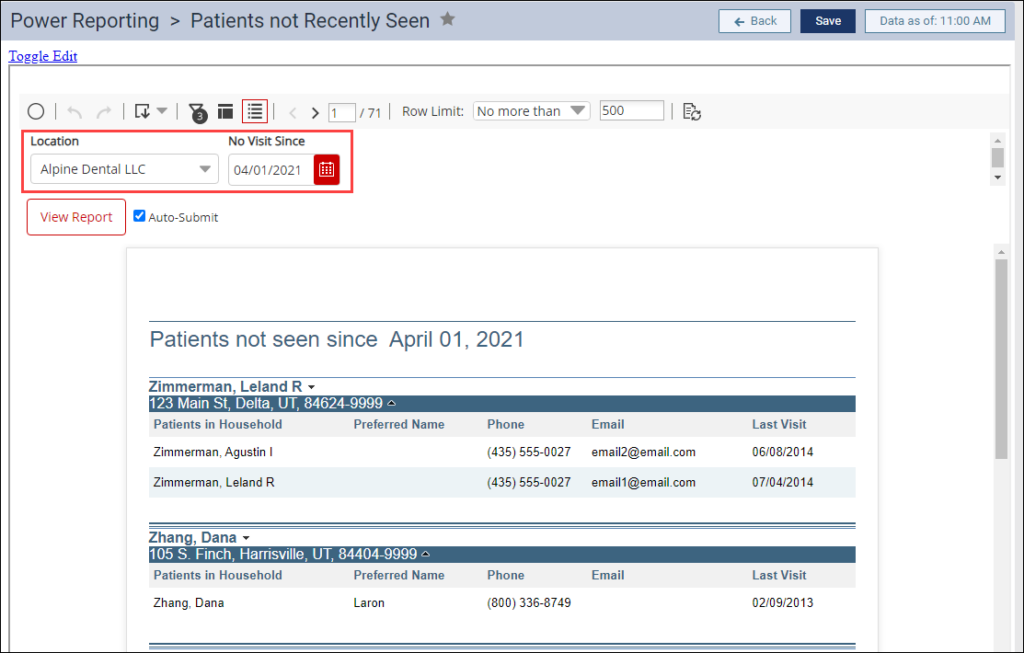

Examples of Interactive Reports: Patients Not Recently Seen, Unscheduled Treatment, Missed Appointments
Reporting Formats: Pre-Built vs Builders
There are two formats of Analysis reports and Interactive reports: Pre-Built and Builders. Let’s look at the differences between these two formats and when you would use each one.
|
Pre-Built Reports |
Builders |
|
|